File:
Preview:
What can I do with this file?
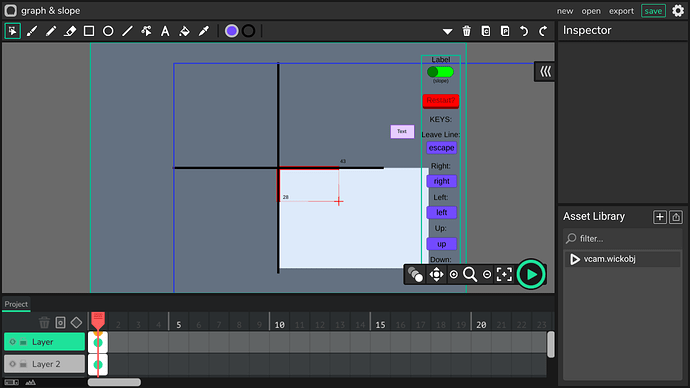
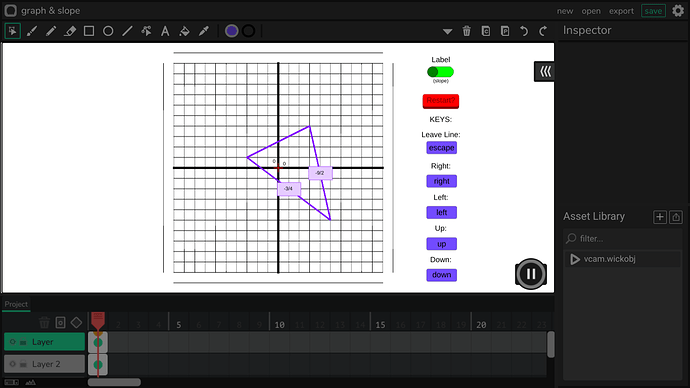
Plot a point, it’ll give you the x, y, then plot the other point, it’ll give the x and y for that point and create a line. Once you’re sure, click elsewhere to have the line marked on the graph, and it’ll show you the slope of the line with a label. If you’re not sure you wanna plot something, press “escape.”
You can press arrow keys to move right, left, up, down. To change these keys, go to the “KEYS” section on the right, click the key you want to change, and once you see the words, “[KEY],” press any key to set it to that key.
Anything else?
If anything needs improvement, let me know. If you don’t understand anything, let me know so I can help. Also, for the simplifying function, I stole it from online, and thank you to @Nick who gave me the rotating code months ago (which I still use today : )
The restart button deletes all lines & labels.
Use arrows (or the keys that you set) to move outside of the screen and plot points.
If labels get annoying, you can hide them by clicking that switch. If a label is off, let me know where you plotted the points so I can know what’s wrong with my code to fix (it depends on rotation and size of the line when I wanna find it’s center, so giving me where you plotted the points in order of which one was plotted first is helpful)
Also, this is my first attempt at programming a graph, so I didn’t know what a graph would need. I added a slope and a line, and I feel like there’s more I should add, so I’m open to all suggestions.
Feel free to edit the file
Thank you : )


